Fails to materialize once again after the facts overwhelm the doom and gloom narrative popularized by the MSM. Earnings didn’t go bust, foreign investment remains robust and the hard factual economic data continues to perform reasonably well.
Following last weeks’ substantial gains. The S&P 500 lost 155 points or 2.6%, the NASDAQ gave up 1,474 points or 7.67%, while the DOW slipped 1,052 points or 2.47%. Leaving the markets mixed YTD following their brief trip into positive territory again for the year.
Who’s on 1st? Who’s on 2nd? Who’s on 3rd?
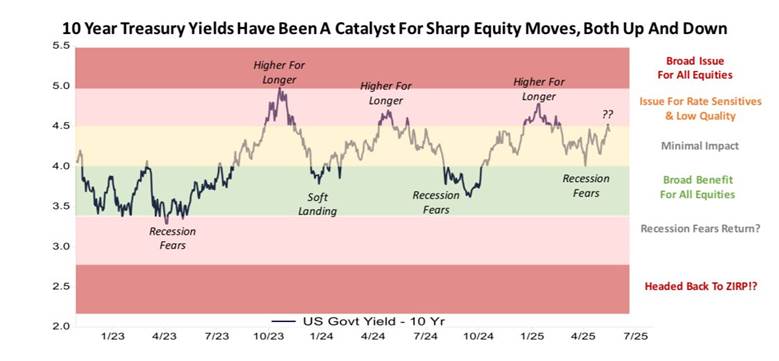
The MSM continues to struggle with the question with respect to interest rates and recessions. Recently predicting the most dire consequences, sharply higher interest rates and a recession as a byproduct of tariffs. With 8 narrative rotations in bond markets since late 2022. Recession… no landing … soft landing … no landing … recession … no landing … recession … etc. It flips every 4-5 months or so. As the chart below shows.

At least for now. Narrative volatility is here to stay and filters through to soft economic data, aka sentiment surveys, as the drumbeat of fear continues. The latest round of tariff inspired doom and gloom has so far failed to materialize following two consecutive very strong Treasury International Capital or TIC reports for February and March. April TIC data is due mid June, expectations are for another healthy report as the MSM narrative that everything Trump touches turns to dust proves wrong again.
How High?
Will interest rates go, is the question on every real estate agent’s mind as the spring selling season fizzles following the worst April for existing home sales since 2009. The .5% monthly decline pushed inventory for sale to a 9-year high of 4.4 months. A level that is starting to generate considerable concern with mortgage rates remaining stubbornly in the 6.5 to 7% range. As the chart compliments of WolfStreet shows.

Data from the Census Bureau shows that new home sales are also struggling. Despite the 10.9% reported sales gain in April to 743,000 units annualized. The previous months were revised sharply lower. Months’ supply fell to 8.1 a definite improvement but still very high by historical standards. 50% appreciation during the Covid pandemic combined with sharply higher interest rates have combined to push affordability beyond the reach of many. With the years’ interest rate cuts being pushed further into the future, real estate will continue to struggle. Thanks to CalculatedRisk for the chart.

Strong 1st Quarter Earnings
Anemic initial estimates pegged 1st quarter earnings growth for the S&P 500 companies at just 7%. By the time the reporting season had closed the S&P 500 companies marked a second consecutive quarter of double digit earnings growth with 10.9% reported. Revenues increased 4.4% as the actual numbers continue to beat consensus and defy the naysayers. As the chart shows.

Last Week’s Post: The Sky Didn’t Fall
Follow me on Social Media
X: Caleb Lawrence (@CalebRIAInc) / X
Substack: @themarketbull
LinkedIn: Caleb Lawrence | LinkedIn
Leave a Reply
You must be logged in to post a comment.