Notwithstanding numerous predictions to the contrary. Inflation continues to slip with the CPI or Consumer Price Index coming in below expectations for May at +.1% and just 2.4% from a year ago. The Producer Price Index or PPI came in at the low end of expectations in May up.1%. On a year ago basis the PPI came in at 2.6%, the upper end of the expected range.
A Decent Week for the Markets
Despite Israel’s unfortunate attack on Iran that sent the major averages into the close Friday with significant losses. For the week, the markets finished with small losses. The S&P 500 lost 23 points or .38%, while the NASDAQ slipped 127 points or .65%, the Dow finished down 565 points or 1.32%.
The Atlanta Fed
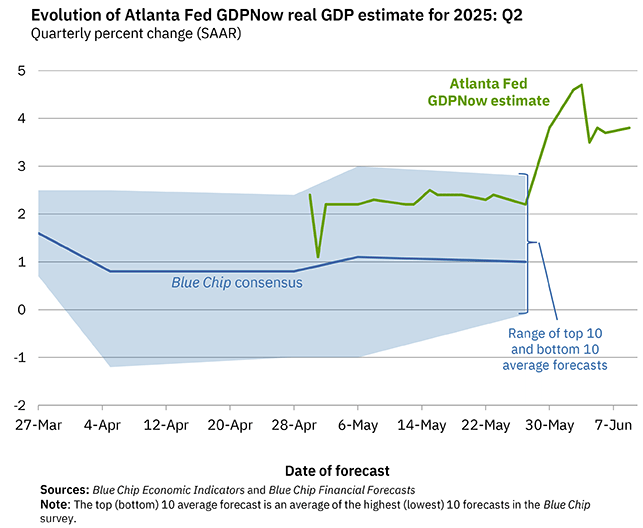
While their GDPNow estimate tends to go all over the map and was wildly wrong last quarter predicting a disastrous decline. That turned out to be a trivial -.1% after revisions so far. The Atlanta Fed GDPNow report is tracking Q2 GDP of +3.8% as of June 9. The latest estimate from Goldman Sachs is +.4% to +3.7%, a very confident set of numbers to be sure. Despite predictions to the contrary, destroying things does not improve economic activity or condition. So, I would think that all the riots and protests will have some, as yet to be quantified, negative economic consequences. Though I expect 2nd quarter GDP to run a respectable 3.5% or so. Thanks to the Atlanta Fed for the chart below.

First Quarter 2025 Flow of Funds
Despite reckless and irresponsible spending by the Biden administration in its closing months. The Fed’s Q1 Flow of Funds Report shows household net worth fell by 1.6 trillion, to 169.3 trillion. Some of the reports highlights, or lowlights depending on your perspective include the following. Equities fell by 2.3 trillion, while real estate gave up .2 trillion, while household debt grew by 1.9% annualized. Despite the first quarter decline and some ups and downs that you see with just about everything total household net worth as a percentage of GDP continues to improve. Per the chart below, thanks to CalculatedRisk.

Total household net worth as a percentage of GDP or Gross Domestic Product 1952 through Q1 2025. Despite some ups and downs it has steadily increased, particularly in the last 45 years.
Last Week’s Post: Is the Bromance Over?
Follow me on Social Media
X: Caleb Lawrence (@CalebRIAInc) / X
Substack: @themarketbull
LinkedIn: Caleb Lawrence | LinkedIn
Leave a Reply
You must be logged in to post a comment.