Despite a parade of doom and gloom from the mainstream media this year. The markets, economy and earnings all continue to perform well. Leaving me to wonder, “are they wrong”? Or just “early”? Certainly, their predictions this year have been considerably off target. Endless recession calls, much higher inflation and falling financial markets that have so far failed to materialize. For the week the major averages added modestly to last week’s impressive advances. The S&P 500 gained 21 points or .31%, the NASDQ increased 212 points or .91% while the Dow added 239 points or .5%.
What About the Data?
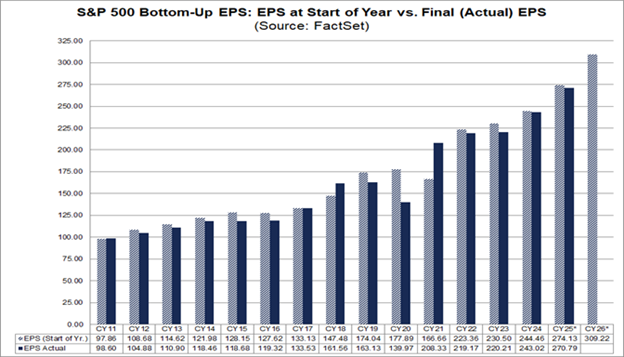
4 quarters of double-digit earnings growth for the S&P 500 companies is getting topped of with a 3-year high of 8.4% revenue growth for the 3rd quarter. Led by the Information Technology, Health Care, and Communication Services sectors. So much for tariffs precipitating a devastating trade war. For all of 2025, S&P 500 aggregate earnings are expected to run $274.95. Estimates for 2026 are currently $309.22. Meaning analysts expect double digit growth of about 12.5%. Hardly recessionary, that said it is worth noting that analysts tend to be an overly optimistic bunch and generally come in on the high side by some 6.2%. Per FactSet research, who also provided the chart. 
Consumer Spending Equals 68.2%
Of total USA GDP, it is very hard to get a recession if consumers don’t slow spending. Which is of course tied to their collective paychecks or earnings, aka personal income. The latest data from the Bureau of Economic Analysis shows personal income up .4% in September, helping to drive a .3% gain in Personal Consumption Expenditures during the month. Year to Date or YTD these figures are up 4.9% and 3.8% respectively.
Light vehicle sales continue along in their 15-16 million units annualized range seen over the last few years. The Bureau of Economic Analysis or BEA reported 15.6 million units annualized in October. So much for the tariffs. Thanks to the BEA and CalculatedRisk for the chart.
Lies, Dam Lies and Statistics
A quote often attributed to Mark Twain who popularized it. Its original origin is uncertain. Price Earnings or P/E ratios however are certain. Currently from a historical perspective the NASDAQ and S&P 500 are mixed. Compared to the Dot-Bomb period of 2000. The S&P 500 is slightly higher on a trailing P/E basis of 31 compared to 2000’s 28.3. Forward P/E estimates are running a more modest 24 now compared to 26+ in 2000. For the NASDAQ it is a different story forward P/E ratios hit 60, while trailing P/E’s were knocking on the door for 200 during the Dot-Bomb period. Presently the NASDAQ P/E ratios are 26 and 34.65 respectively. Worth watching to be sure but hardly cause for alarm given the 2026 earnings estimates and recent revenue data.
I’m sure there will be a recession one day, just not anytime soon.
Have a great weekend everyone! See you next Friday.
Last Week’s Post: More Losses
Follow me on Social Media